Overview
Our AI-enabled analytics platform can ingest historical multi-year data from google sheets, excel files, and other data sources where you are entering your capstone, certification, and follow-up data. This platform can help you identify patterns leading to insights about programming effectiveness, future growth areas, retention issues, and employment outcomes. The platform also provides ready-made metrics/benchmarks for state/EMIS reporting.
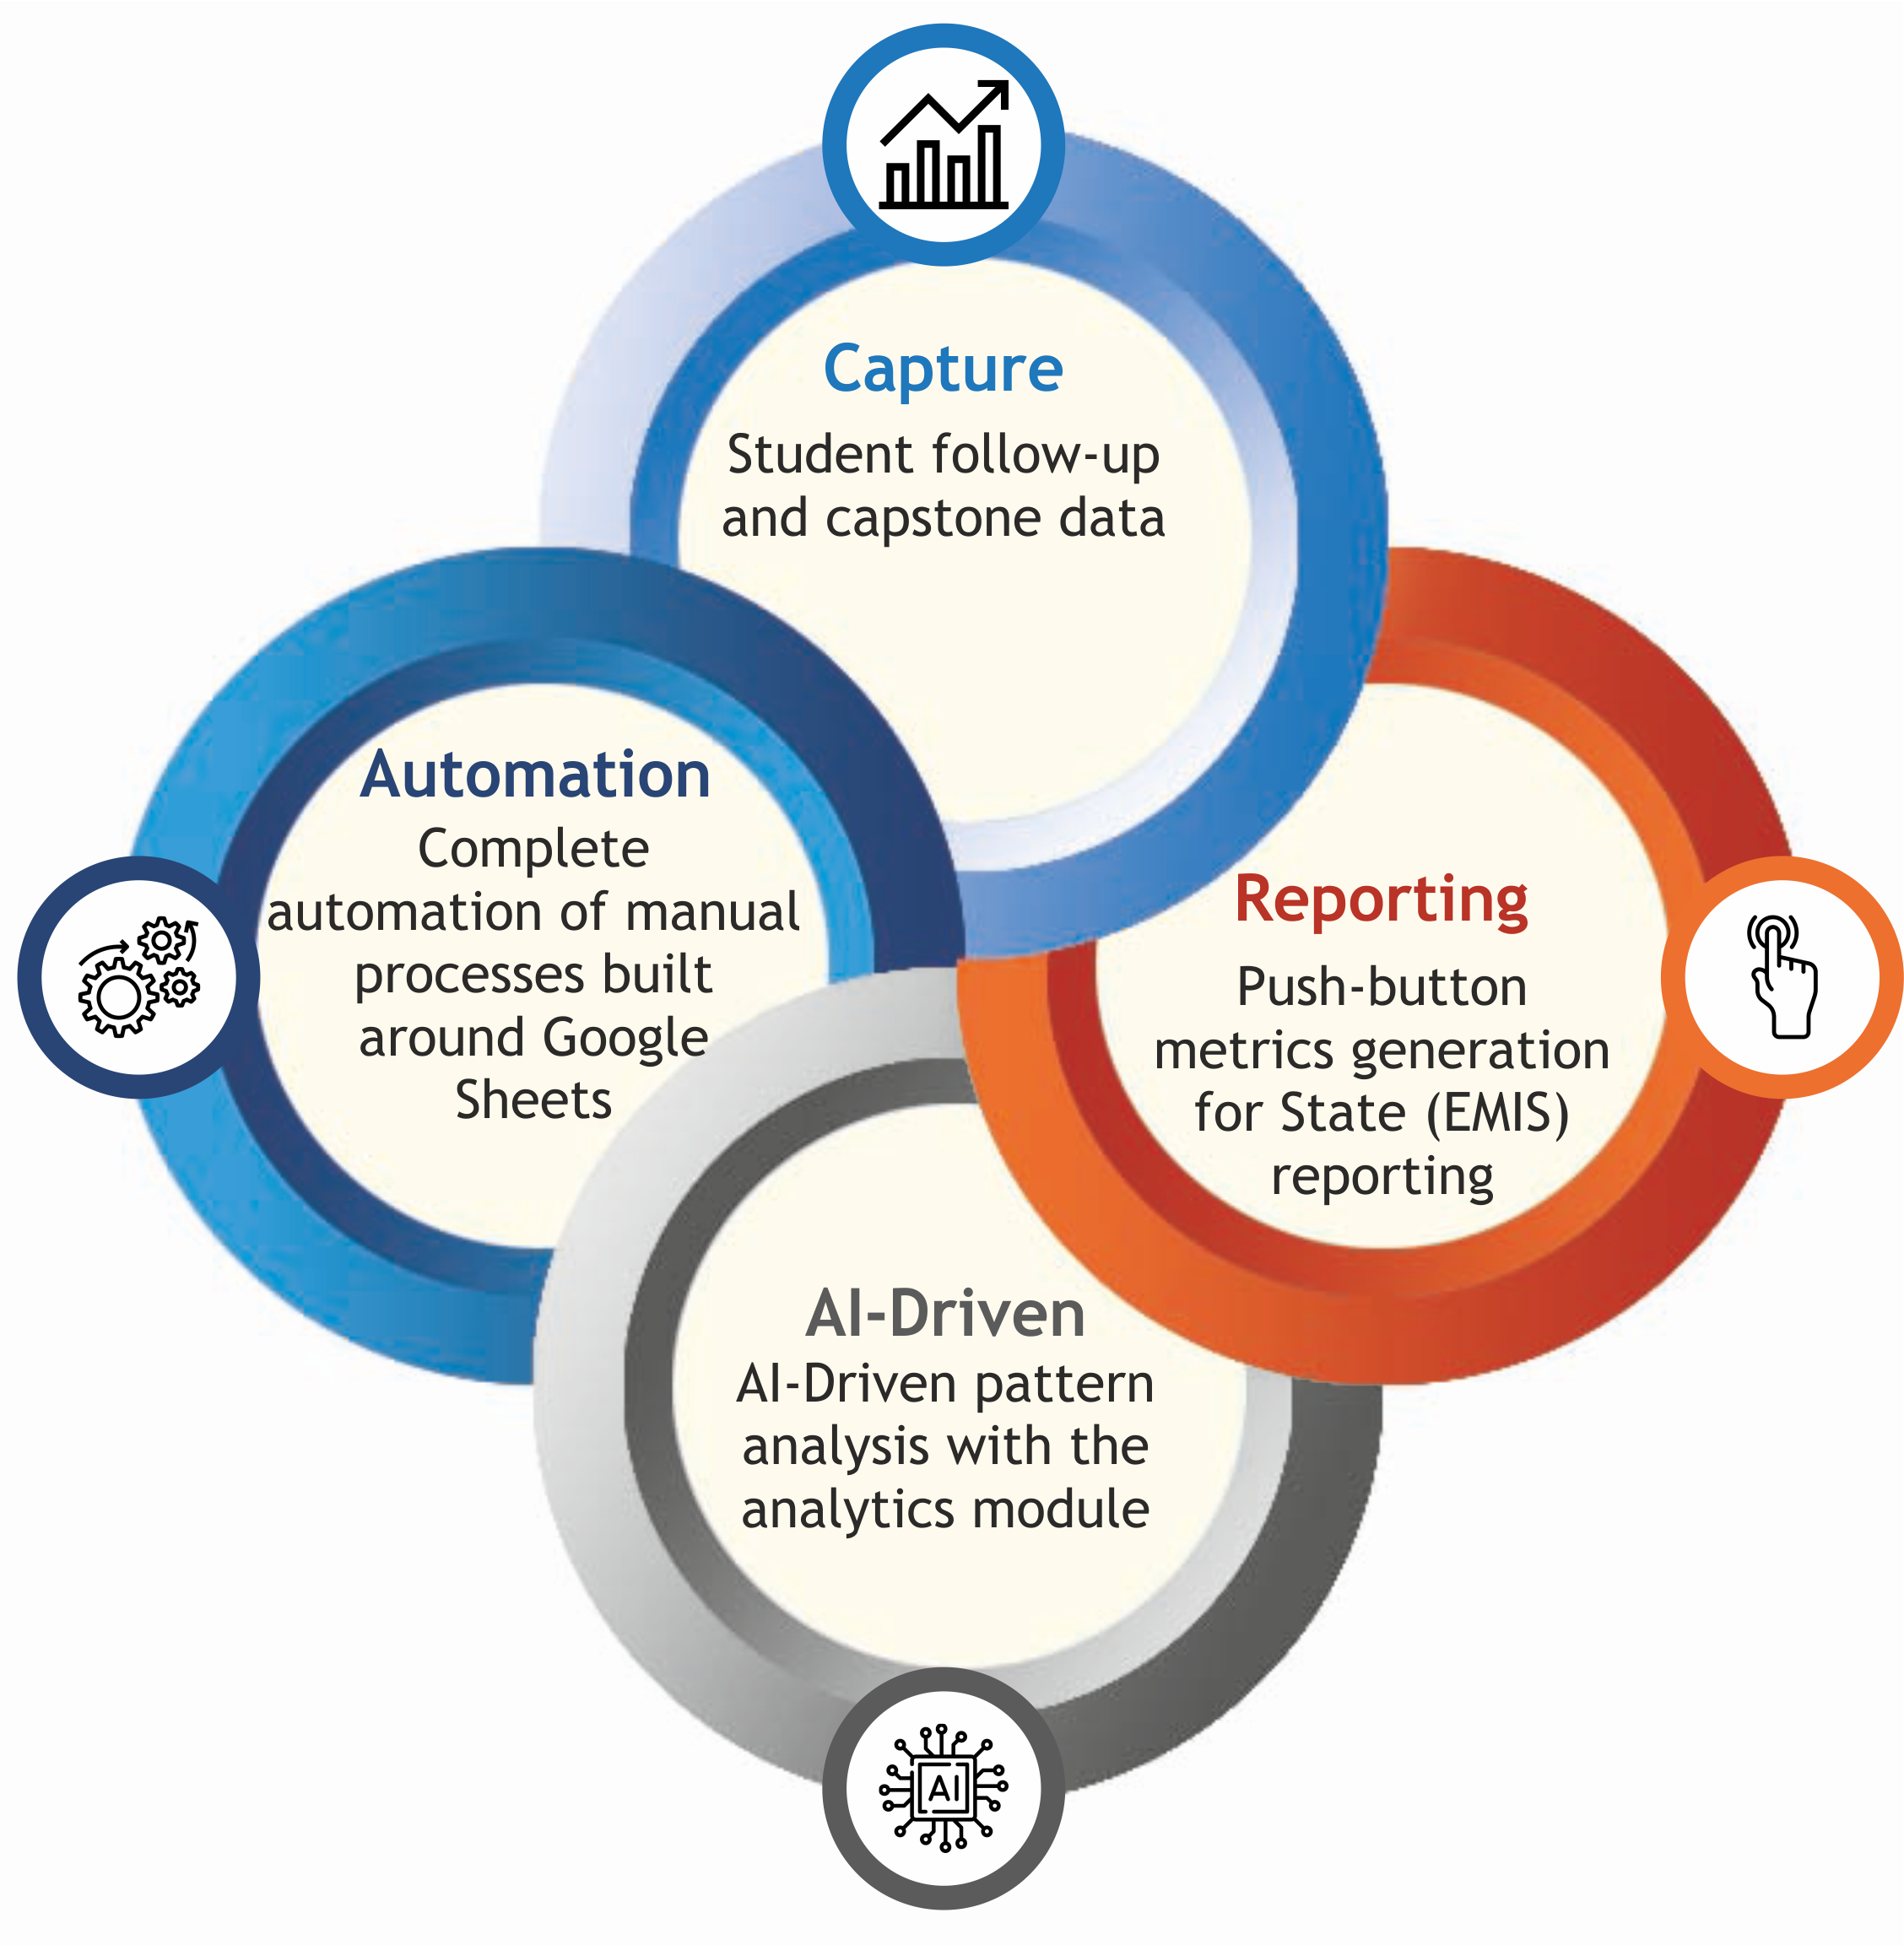
Student follow-up and capstone data
Push-button metrics generation for State (EMIS) reporting
AI-Driven pattern analysis with the analytics module
Complete automation of manual processes built around Google Sheets
Overview
Our AI-enabled analytics platform can ingest historical multi-year data from google sheets, excel files, and other data sources where you are entering your capstone, certification, and follow-up data. This platform can help you identify patterns leading to insights about programming effectiveness, future growth areas, retention issues, and employment outcomes. The platform also provides ready-made metrics/benchmarks for state/EMIS reporting.

eMoksha's Tracker platform completely transformed our data capture processes for follow-up, credentials, certification, and work-based learning. This transformation is leading to more efficiency, better quality, and significant time savings for teachers, administrative staff, and the management at R G Drage. In addition, by recognizing patterns in the historical data, evidence-based tactical and strategic decisions can be made about various programs, offerings, and available resources ultimately helping the center to stay focused on student success and achieve better outcomes.
DAN MURPHY
Director, RG Drage Career Center

eMoksha's analytics platform is helping us dig into years of historical data identifying patterns leading to insights about programming effectiveness, future growth areas, gaps in programming, and retention / program completion issues at an overall center level as well as district/programming level. This tool gives me the big picture I was looking for and provides information at my fingertips to help identify opportunities to optimize various programs/offerings and keep us bullet-focused on student success.
KRISTA GEARHART
Director of CTE, South Stark Career Academy

eMoksha's Data Science Services and analytics platform has opened up undiscovered avenues for us from state reporting data that we struggled to make sense of in the past. We have identified new ways of interpreting the data that is making us more effective and efficient while fostering informed discussions among stakeholders and enabling decisive actions. The patterns we’re uncovering allow us to proactively address potential compliance challenges, ensuring we stay aligned with state requirements. This data driven approach is saving us significant time and effort, keeping us laser-focused on improving our student outcomes and contributing to the process for developing new programs
Mary Jane Stanchina
Executive Director
Six District Educational Compact
Our Career-Tech Platform solves problems and provides answers
Are you using Google Sheets and Excelfiles for Follow-up, Credentials, and Capstone data?

Are you struggling with data quality when doing EMIS/State Reporting?

Are teachers and coordinators spending several cycles of multiple reviews to get data right?
Does everyone see the same data,in real-time?

Do you know which courses are leading to higher direct employment rates and what those rates are?

Does the learning industry credentials path lead to better employment opportunities?
Platform Features

Simple to Use

Easy to Navigate

Self-service

Configurable for the future
Benefits

STAFF REPORTING EFFICIENCY
Readymade data and metrics available for state reporting

DATA QUALITY CONTROL
Time and effort saved in maintaining data

REAL-TIME UPDATES ANALYTICS
Real-time updates make data available to all
